Air emissions
KPO manages air pollutant emissions based on the limits established in the Environmental Impact Permit.
To control compliance with the limits, the Company monitors industrial emissions. At the KPO facilities, the air emissions are mainly released from sour gas and mixture of formation fluids (MFF) flaring, fuel gas flaring in turbines, furnaces and boilers, from diesel fuel flaring in diesel-generator units. The sulphur dioxide, carbon oxide and nitrogen oxides are the main combustion products.
Across KPO the direct greenhouse gas (GHG) emissions are regulated under the national quotas trading system.
Tab. 33. Emissions management targets / GRI 3-3 /
|
Our 2024 targets |
Target achievement status |
Actions taken in 2024 |
Targets for 2025 |
|---|---|---|---|
|
Explore additional opportunities for implementation of Tail Gas Treatment Units |
Completed by 50 % |
|
|
Graph 20. Pollutant emissions in KPO by main air pollution sources, in 2024
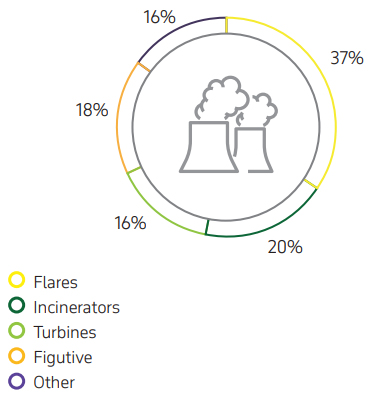
In 2024, the total amount of air emissions was increased by 8 % compared to 2023, totalling 6,198 tonnes. The increase in emissions in 2024 is justified by the increase of condensate production by 1 %, and gas by 7 % compared to 2023, and commissioning of the KEP-1A facilities. Table 34 shows data on permissible and actual KPO emissions for the 2022– 2024 period.
Across KPO the direct greenhouse gas (GHG) emissions are regulated under the national quotas trading system.
Tab. 34. Permitted and actual volumes of pollutant emissions, 2022–2024 / GRI 305-7, SDG 3.9, 12.4 /
|
Annual volume of emissions by pollutants, in tonnes: |
2024 |
2023 |
2022 |
|---|---|---|---|
|
Permitted emissions: |
12,602 |
11,346 |
12,005 |
|
Actual, including: |
6,198 |
5,765 |
5,236 |
|
Nitrogen oxides (NOх) |
1,505 |
1,362 |
1,182 |
|
Sulphur dioxide (SO2) |
2,294 |
2,251 |
2,143 |
|
Carbon dioxide (CO2) |
1,235 |
1,159 |
1,142 |
|
Volatile organic compounds |
539 |
513 |
534 |
|
Hydrogen sulphide (H2S) |
3 |
3 |
3 |
|
Solid particles |
578 |
441 |
198 |
|
Other |
45 |
36 |
34 |
In KPO, emissions are calculated using the methods specified in MPE project and recommended for use in the Republic of Kazakhstan.
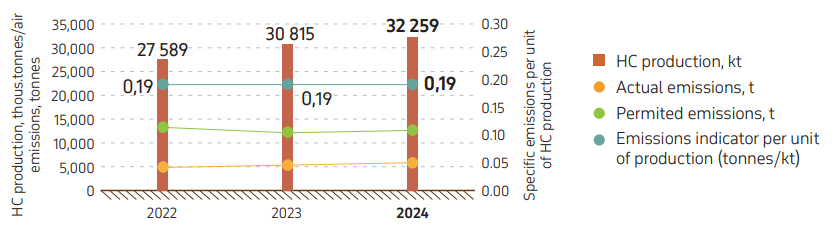
In 2023, specific emissions per unit of production amounted to 0.29 tonnes per 1,000 tonnes of hydrocarbons (HC) produced same as in 2023.
Graph 21. Volume of HC production and environmental emissions in 2022–2024
GAS FLARING / SDG 3.9, 7.3, 8.4, 12.2, 12.4, 12.5 /
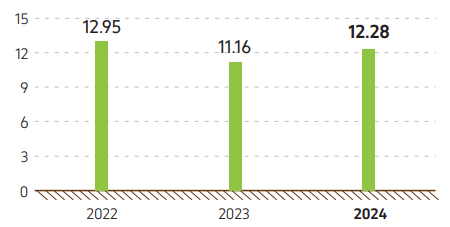
In 2024, the total amount of gas flared reached 0.05 % (0.05 % in 2023) of the total volume of gas produced or 0. 34 tonnes per thousand tonnes of produced hydrocarbons. Such a low flaring emission rate resultant from flaring testifies of high operational performance against the global industrial average rate of 8.77 tonnes per one thousand tonnes and European average rate of 2.23 tonnes per one thousand tonnes, as follows from the 2023 IOGP Report. This confirms the very high level of KPO for this indicator among the global and European oil and gas producers and makes Karachaganak the leading oil and gas condensate field in Kazakhstan in terms of gas utilization.
The slight increase in gas flaring volumes in 2024 comparing to 2023 is due to the commissioning and start-up of the 5th Gas Re-injection Compressor’s turbine and the KEP-1A facility’s high pressure flare
Graph 22. Volumes of produced gas flared in 2022–2024 (mln m3 )
Gas Utilization / SDG 3.9, 7.3, 8.4, 12.2, 12.4, 12.5 /
Pursuant to the legislation requirements, KPO develops and approves with the Regulatory Authorities the Sour Gas Processing Development Programs.
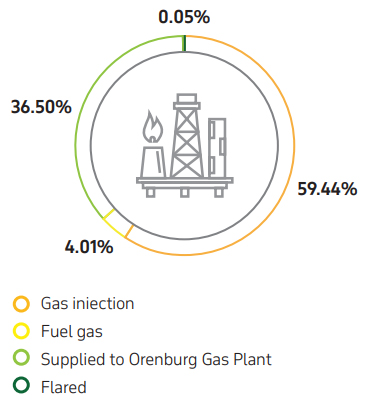
In 2024, the KPO gas utilization rate reached 99.95 % (99.95 % in 2023). The performance target approved by the Rok Authority under the 2024 Associated Gas Processing Development Program is 99,85 %.
Graph 23. Ga utilization and flaring in 2024

Greenhouse gases
Direct Greenhouse Gas emissions / GRI 305-1, 305-7, SDG 3.9, 12.4, 13.1, 13.2 /
Direct greenhouse gas (GHG) emissions are regulated across KPO under the National Quotas Trading System. KPO obtained quotas for 2024 GHG emissions (СО2) in the amount of 2,294,107 tonnes based on specific emissions indicators (benchmarks). In 2024, actual emissions have amounted to 2,118,011 tonnes of CO2, which made 92.3 % of the quota. In January 2024 the residual of the 2023 quota worth 788,530 tonnes of СО2 was added up to the Company.
To ensure the level of GHG emissions is in compliance with the issued quota, KPO quarterly assess GHG emissions for carbon dioxide (СО2) and methane (СН4). The emissions were assessed using the calculation method and based on the Company’s operations data (in terms of fuel consumption and laboratory data on fuel composition) according to the Order No. 9 of the Minister of Ecology and Natural Resources of the Republic of Kazakhstan dated January 17, 2023 “On Approval of Greenhouse Gas Emissions and Absorption Calculation Methodologies”.
Rates used for analysis of the GHG emissions are calculated quarterly as per the laboratory data of the certified KPO Chemical Laboratory.
To convert the GHG emissions into carbon dioxide equivalent (СO2-eq.), the global warming potential values were used according to item 4 of Decision of Conference of the Parties 6/СР.27 of November 17, 2022.
At the year-end, independent certified organization shall verify monitoring results and produce an Inventory report for the reporting period.
According to the verified GHG Emissions Inventory Report for 2024, the total volume of GHG emissions amounted to 2,139,054 tonnes in СО2-equivalent, of which СО2 contribution equalled to 2,118,011 tonnes of СО2-equiv. (99 %), CH4 – 12,133 tonnes of С?О2-equiv. (0.6 %), N2O – 8,910 tonnes of СО2-equiv. (0.4 %).
Information on the dynamics of generated GHG emissions is provided in Table 35. The slight increase in GHG emissions (by 6 %) in 2024 compared to 2023 is due to commissioning of the 5th Gas Re-injection Compressor and High Pressure Flare.
Tab. 35. Dynamics of GHG emissions generated from KPO production activities, 2022–2024 / SDG 13.2.2 (C130202) /
|
Total volume of greenhouse gas emissions from stationary and fugitive sources, tonnes of CO2 equivalent |
|||||
|---|---|---|---|---|---|
|
From fuel combustion at stationary sources |
From fuel combustion at flares and incinerators |
Fugitive emissions |
Total GHG emissions in 2024 |
Total GHG emissions in 2024 |
Total GHG emissions in 2024 |
|
1,980,948 |
149,145 |
8,961 |
2,139,054 |
2,012,982 |
1,851,066 |
|
Total volume of greenhouse gas emissions from mobile sources, tonnes of CO2 equivalent |
|||
|---|---|---|---|
|
Flaring diesel and gasoline from mobile sources |
Total GHG emissions in 2024 |
Total GHG emissions in 2024 |
Total GHG emissions in 2024 |
|
1,683 |
1,680 |
1,750 |
|
The Methodology for calculating GHG emissions from fugitive emissions sources
To count the GHG emissions from fugitive emission sources, KPO uses its own methodology developed for efficient monitoring and approved by the Ministry of Ecology, Geology and Natural Resources of the Republic of Kazakhstan in 2020. This Methodology has allowed gaining more accurate data of methane (СН4) emissions from fugitive emission sources at KPO facilities and significantly minimize calculations uncertainty. The Methodology is applied during the annual GHG emission inventory process.
The Scope 2 emissions calculation has been conducted only for the purchased energy in the field facilities.
Specific greenhouse gas emissions / GRI 305-4, SDG 13.1 /
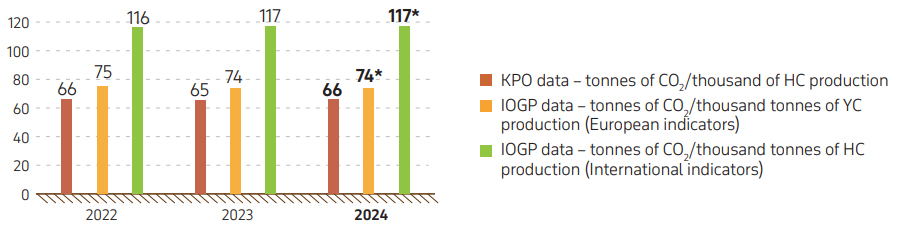
In 2024, the KPO specific indicator of СО2 emissions totalled 66 tonnes of СО2/thousand tonnes of produced hydrocarbons. Graph 21 shows the dynamics of specific GHG emissions comparing to the specific emissions data provided by the IOGP. The actual specific GHG emissions in KPO are lower than the European indicators by 11 % and lower than the international indicators by 44 %.
Graph. 24. Dynamics of specific GHG emissions per unit of HC production*, 2022–2024
Indirect greenhouse gas emissions / GRI 305-2 /
Indirect GHG emissions at KOGCF resulting from the consumption of imported electric power in 2024 account for an insignificant part (less than 0.1 %), since the Company has a gas turbine power plant, the main purpose of which is to provide its own electricity to the entire production complex of the Field and nearby settlements.
These emissions are not subject to accounting and are not included in the reporting under the internal system of quotas for GHG emissions of the Republic of Kazakhstan. Information on them is provided only in reports to KPO Parent Companies. In 2024, the indirect GHG emissions at KPO amounted to 946 tonnes of СО2 .
* The data was sourced by Annual report of the International Associations of Oil and Gas Producers (IOGP) – “Environmental Performance Indicators – 2023 data”. The 2023 data was used for comparison purpose in 2024, as the 2024 IOGP Report was not available at the time this Report was prepared.
/ GRI 3-3 /
Air pollution harms human health, affects food security, hinders economic development, leads to loss of biodiversity, contributes to climate change and degrades the environment that people rely on for their livelihoods. The United Nations recognize air pollution as one of the major threats to human and planetary health.
The KPO industrial complex operation is inevitably associated with the air pollutant emissions. Pollutants are generated on all process stages: production, preparation, storage and transportation of gas and condensate. Reduction of emissions, recycling of waste and application of new technologies remain the most important issues on the Company’s agenda. The Company’s mission in this matter is to minimize the negative impact of its activities.