Air emissions
KPO manages air pollutant emissions based on the limits established in the Environmental Impact Permit.
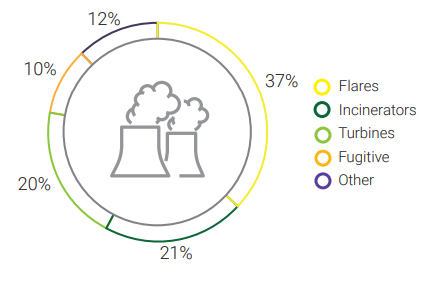
The main volume of emissions is generated as a result of gas combustion in flares (37 %), incinerators (21 %), gas turbine units (20 %), boilers, process heaters and compressors (12 %), as well as from fugitive sources (10 %) as shown in Graph 17.
Regulation of direct greenhouse gas (GHG) emissions in KPO is carried within the framework of the current national emissions trading system.
In 2021, total air emissions decreased by 37 % compared to 2020 and amounted to 4,798 tons. The reduction in emissions is mainly due to the absence of well operations in 2021, accompanied by hydrocarbons well flaring.
Graph 17. Pollutant emissions in KPO by main air pollution sources, in 2021
Why is it important to us?
Activity of such industrial enterprises as KPO is always associated with air emissions. Emissions of harmful substances into the air leads to environmental disorder. In this regard, KPO’s goal is to reduce the negative effect of its activities.
In 2021, the Company continued testing new methods to reduce hydrocarbon flaring during well development. In the result of testing a technology with a high-pressure separator in combination with high flow pumps applied on the four wells in 2020 (3 wells) and 2021 (1 well), a reduction of emissions by ~24 thousand tons of CO2 - equivalent and additional production of ~53 thousand barrels was achieved.
Tab. 32. Targets in managing emissions
|
Our 2021 targets |
Target achievement |
Actions taken in 2021 |
Targets for 2022 |
|
Ensure that specific GHG emissions do not exceed 67 tonnes of СО2 per one thousand tonnes of produced hydrocarbons |
Completed |
Specific GHG emissions amounted to 62 tonnes of CO2 per one thousand tonnes of produced hydrocarbons |
|
|
Ensure that the throughput losses do not exceed 3.82 % |
Completed |
Throughput losses amounted to 3.54 %. |
|
|
|
New targets |
|
Develop and pass verification/validation of regulatory and technical documentation to obtain a quota for 2022–2025 GHG emissions Obtain a quota for GHG emissions for 2022–2025 |
Table 33 shows data on the permissible and actual KPO emissions for the period of 2019 – 2021
Tab. 33. Permitted and actual volumes of pollutant emissions, 2019–2021
|
Annual volume of emissions by pollutants, in tonnes: |
2021 |
2020 |
2019 |
|
Permitted: |
13,219 |
17,527 |
18,544 |
|
Actual, including: |
4,798 |
7,591 |
7,597 |
|
Nitrogen oxides |
1,197 |
1,637 |
1,636 |
|
Sulphur dioxide |
1,989 |
3,315 |
3,281 |
|
Carbon monoxide |
1,039 |
1,145 |
1,205 |
|
Volatile organic compounds |
452 |
1,352 |
1,329 |
|
H2S |
3 |
3 |
3 |
|
Solid particles |
71 |
74 |
80 |
|
Other |
47 |
65 |
63 |
In KPO, the emissions are calculated using the technics specified in the statutory emissions limits and recommended for use in the Republic of Qazaqstan.
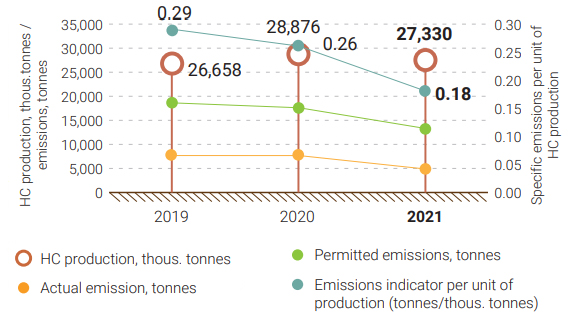
In 2021, the specific emissions per unit of production amounted to 0.18 tonnes per 1,000 tonne of hydrocarbons (HC) produced. Reduction in specific emissions in 2021 versus 2020 is attributed to reduction of total emissions, due to the lack of work on wells followed by hydrocarbon combustion, as well as a shorter operating time of equipment that makes the main contribution to gross emissions.
Graph. 18. Hydrocarbons production and environmental emissions in 2019–2021
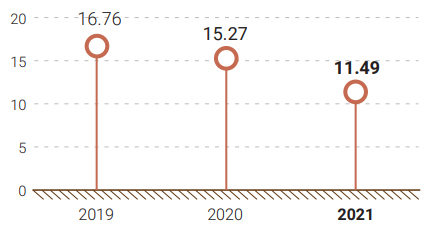
Graph 19. Volume of associated gas flared, 2019–2021 (mln m3)
Graph 20. Gas utilization and flaring in 2021
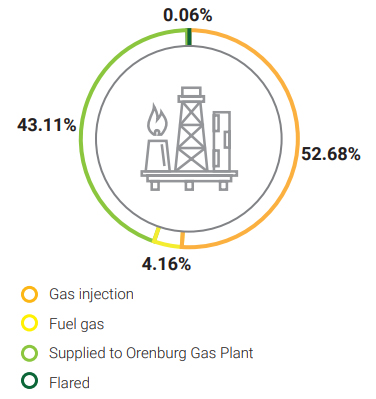
GAS FLARING
In 2021, the total amount of flared gas was 0.06 % (0.08 % in 2020) of the total volume of gas produced or 0.38 tonnes per thousand tonnes of produced hydrocarbons. Such a low flaring emission rate resultant from flaring testifies to high operational performance against the global industrial average rate of 8.0 tonnes per one thousand tonnes and European average rate of 2.4 tonnes per one thousand tonnes8, as follows from the IOGP 2020’s Report. Reduction in gas flaring volumes in 2021 versus 2020 was due to the absence of well operations associated with hydrocarbon flaring and full shutdown.
In 2021, KPO’s gas utilization rate reached
Gas Utilization
In 2021, KPO’s gas utilization rate reached 99.94 % (99.92 % in 2020). The performance target approved by the RoQ Authority under the 2021 Associated Gas Processing Development Programme was 99.69 %.
Direct greenhouse gas emissions
Direct greenhouse gas (GHG) emissions are regulated across KPO in line with the national quotas trading system. KPO has obtained quotas for the 2021 GHG emissions (CO2) in the amount of 2,369,945 tonnes on the basis of specific emissions indicators (benchmark). In 2021, actual emissions amounted to 1,727,683 тонн tonnes of CO2, which made 73 % of the quota.
Assessment of GHG emissions is performed for carbon dioxide (СО2), methane (СН4) and nitrogen oxide (N2O), using the calculation method based on the Company’s operations data (in terms of fuel consumption and laboratory data on fuel composition).
According to the verified GHG Emissions Inventory Report for 2020, the total volume of GHG emissions amounted to 1,745,768 tonnes in СО2-equivalent, of which СО2 contribution equalled to 1,727,683 tonnes of СО2-equivalent (99 %), CH4 – 9,586 tonnes of СО2-equivalent (0.5 %), N2O – 8,499 tonnes of СО2-equivalent (0.5 %).
Information on the dynamics of generated GHG emissions is provided in Table 34. In 2021, minor reduction in GHG emissions (by 4 %) versus 2020 is attributed to a decrease in hydrocarbon production capacity in the reporting year.
Tab. 34. Dynamics of GHG emissions generated from KPO production activities, 2019–2021
|
Total volume of greenhouse gas emissions (tonnes of CO2 equivalent) |
|||||
|
From fuel combustion at stationary sources |
From fuel combustion at flares and incinerators |
Fugitive emissions* |
Total GHG emissions in 2021 |
Total GHG emissions in 2020 |
Total GHG emissions in 2019 |
|
1,602,469 |
136,211 |
7,088 |
1,745,768 |
1,821,604 |
1,870,324 |
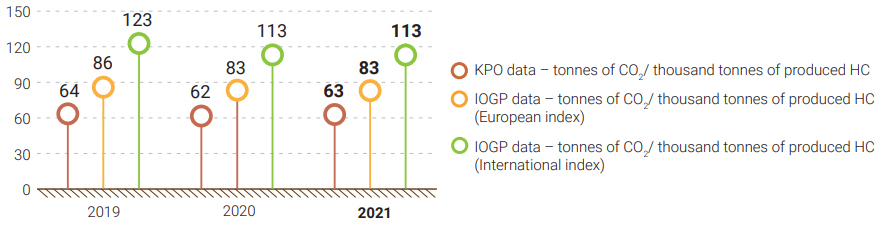
SPECIFIC GREENHOUSE GAS EMISSIONS
In 2021, KPO specific GHG emissions amounted to 63 tonnes of СО2 per thousand tonnes of produced hydrocarbons, which is consistent with the target indicators of the specific GHG emissions of no more than 67 tonnes of CO2 per thousand tonnes of hydrocarbon produced.
Graph 21 shows the dynamics of specific GHG emissions comparing to the specific emissions data provided by the IOGP. The actual specific GHG emissions at KPO are 23 % lower than the European indicators and 44 % lower than the international ones.
Graph. 21. Dynamics of specific GHG emissions per unit of produced hydrocarbons (HC)*, 2019 – 2020