Air pollution harms human health, affects food security, hinders economic development, leads to loss of biodiversity, contributes to climate change and degrades the environment that people rely on for their livelihoods. The United Nations recognizes air pollution as one of the major threats to human and planetary health.
The KPO industrial complex operation is inevitably associated with the air pollutant emissions. The pollutants are produced at all stages of the production cycle: gas and condensate production, treatment, storage and transportation. Reduction of emissions, recycling of waste and application of new technologies remain the most important issues on the Company agenda. The Company’s mission in this matter is to minimize the negative effect of its activities.
Air emissions
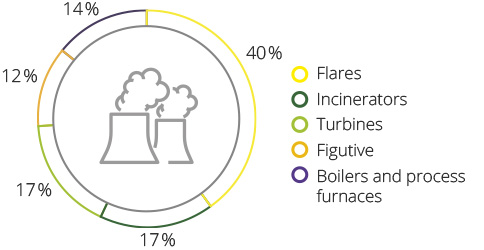
KPO manages air pollutant emissions based on the limits established in the Environmental Impact Permit. To control compliance with limits the Company monitors industrial emissions. The air emissions, at the KPO facilities, are mainly released from sour gas and formation fluid contamination mixtures’ flaring, fuel gas flaring in turbines, furnaces and boilers, from diesel fuel flaring in diesel-generator units. The sulphur dioxide, carbon oxide and nitrogen oxides are the main combustion products.
Regulation of direct greenhouse gas (GHG) emissions in KPO is carried within the framework of the current national emissions quotas trading system.
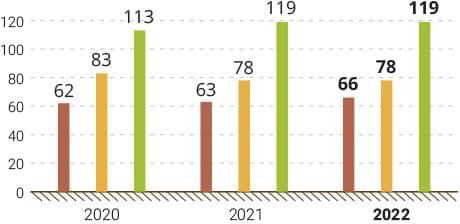
Graph 18. Pollutant emissions in KPO by main air pollution sources, in 2022
Tab. 31. Targets in managing emissions
|
Our 2022 targets |
Target achievement status |
Implementation actions taken in 2022 |
Targets for 2023 |
|
Develop and undergo verification/validation of regulatory documentation to obtain GHG emission quotas for 2022–2025. Obtain quotes for greenhouse gas (GHG) emissions for 2022–2025. |
Completed |
Development and verification of technical documentation for GHG emission quotas for 2022–2025. Timely submission of data for calculation of GHG emission quotas for 2022–2025. |
|
|
|
New objective |
|
Conduct analysis and studies on additional efficient off-gas treatment plants for KPC incinerators. |
In 2022, total air emissions increased by 8 % compared to 2021 and amounted to 5,236 tons. The increase in emissions in 2022 is justified by the turnaround activities at KOGCF facilities and inclusion of Contractor emissions in the Company’s area of responsibility in accordance with the requirements of the new Environmental Code of RoQ. Table 32 shows data on the permissible and actual KPO emissions for the period of 2020–2022.
Tab. 32. Permitted and actual volumes of pollutant emissions, 2020–2022
|
Annual volume of emissions by pollutants, in tonnes: |
2022 |
2021 |
2020 |
|
Permitted emissions: |
12,005 |
13,219 |
17,527 |
|
Actual, including: |
5,236 |
4,798 |
7,591 |
|
Nitrogen oxides (NO)х |
1,182 |
1,197 |
1,637 |
|
Sulphur dioxide (SO2) |
2,143 |
1,989 |
3,315 |
|
Carbon dioxide (CO2) |
1,142 |
1,039 |
1,145 |
|
Volatile organic compounds |
534 |
452 |
1,352 |
|
Hydrogen sulphide (H2S) |
3 |
3 |
3 |
|
Solid particles |
198 |
71 |
74 |
|
Other |
34 |
47 |
65 |
Note.: Emission volumes data are provided in accordance with the data of statistical report «2-TP Air».
In KPO, emissions are calculated using the methods specified in MPE project and recommended for use in the RoQ.
Graph 19. Hydrocarbons production volume and environmental emissions in 2020–2022
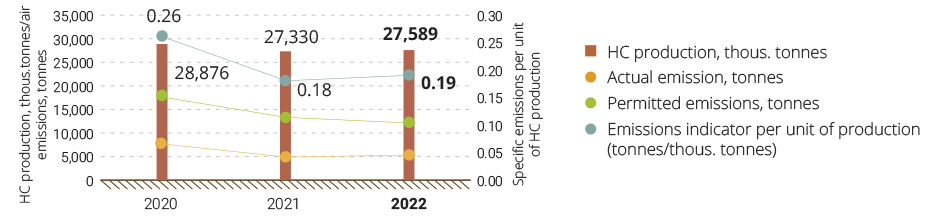
In 2022, the specific emissions per unit of production amounted to 0.19 tonnes per 1,000 tonne of hydrocarbons (HC) produced. Slight increase of specific emissions in 2022 comparing to 2021 is related to increase of actual emissions by 8 % due to reasons described above.
Gas Flaring
Reduction of the gas flaring volumes remains one of KPO key commitments.
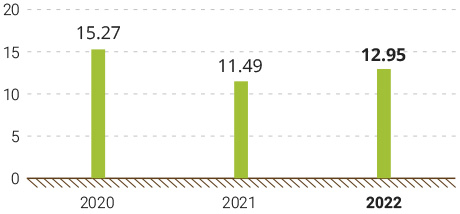
In 2022, the total amount of flared gas was 0.07 % (0.07 % in 2021) of the total volume of gas produced or 0.42 tonnes per thousand tonnes of produced hydrocarbons. Such a low flaring emission rate resultant from flaring testifies to high operational performance against the global industrial average rate of 8 tonnes per one thousand tonnes and European average rate of 2.4 tonnes per one thousand tonnes, as follows from the IOGP 2021’s Report. This confirms the very high level of KPO for this indicator among global and European oil and gas producers and makes Karachaganak the leading oil and gas condensate field in Qazaqstan in terms of gas utilization. Slight increase in gas flaring volumes in 2022 comparing to 2021 is related to full shut down for turnaround which required flaring, as well as due to commissioning and start up of the new High Pressure Flare at Unit-2.
Graph 20. Volume of associated gas flared, 2020–2022 (mln m3)
Gas Utilization
In accordance with legislation requirements, KPO develops and approves with Regulatory Bodies the Programs of sour gas processing development.
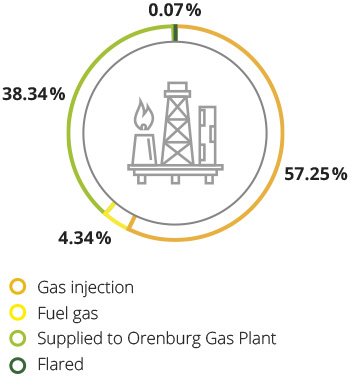
In 2022, KPO’s gas utilization rate reached 99.93 % (99.94 % in 2021). The performance target approved by the RoQ Authority under the 2022 Associated Gas Processing Development Programme was 99.82 %.
Graph 21. Gas utilization and flaring in 2022 .

GHG emissions
Direct GHG emissions
Regulation of direct greenhouse gas (GHG) emissions in KPO is carried within the framework of the current national emissions quotas trading system. KPO has obtained quotas for the 2022 GHG emissions (CO2) in the amount of 2,334,396 tonnes on the basis of specific emissions indicators (benchmark). In 2022, actual emissions amounted to 1,828,569 tonnes of CO2, which made 78 % of the quota.
Assessment of GHG emissions is performed for carbon dioxide (СО2), methane (СH4) and nitrous oxide (N2O), using the calculation method on the basis of the Company’s operations data (in terms of fuel consumption and laboratory data on fuel composition).
According to the verified GHG Emissions Inventory Report for 2022, the total volume of GHG emissions amounted to 1,851,066 tonnes in СО2-equivalent, of which СО2 contribution equalled to 1,828,569 tonnes of СО2-equivalent (98.8 %), CH4 – 13,852 tonnes of СО2-equivalent (0.7 %), N2O – 8,645 tonnes of СО2-equivalent (0.5 %).
Information on the dynamics of generated GHG emissions is provided in Table 33. In 2022, minor increase in GHG emissions (by 5.6 %) versus 2021 is due to the commissioning of 4th gas reinjection compressor.
Tab. 33. Dynamics of GHG emissions generated from KPO production activities, 2020–2022
|
Total volume of greenhouse gas emissions (tonnes of CO2 equivalent) |
|||||
|
From fuel combustion at stationary sources |
From fuel combustion at flares and incinerators |
Fugitive emissions |
Total GHG emissions in 2022 |
Total GHG emissions in 2021 |
Total GHG emissions in 2020 |
|
1,696,538 |
143,093 |
11,435 |
1,851,066 |
1,745,768 |
1,821,604 |
Specific GHG emissions
In 2022, KPO specific GHG emissions amounted to 66 tonnes of СО2 per thousand tonnes of hydrocarbons produced, which is 4.5 % higher than the same figure for 2021. Graph 21 shows the dynamics of specific GHG emissions comparing to the specific emissions data provided by the IOGP. The actual specific GHG emissions at KPO are 15 % lower than the European indicators and 44 % lower than the international ones.
Graph 22. Dynamics of specific GHG emissions per unit of produced hydrocarbons (HC)*, 2020 – 2022
* The data was sourced by Annual report of the International Associations of Oil and Gas Producers (IOGP) – “Environmental Performance Indicators – 2021 data”. The 2021 data was used for comparison purpose in 2022, as the 2022 IOGP Report was not available at the time this issue was prepared.
Indirect GHG emissions
Indirect GHG emissions at Karachaganak Field resulting from the consumption of imported electricity in 2022 account for an insignificant part (0.1 %), since the company has a gas turbine power plant, the main purpose of which is to provide its own electricity to the entire production complex of the field and nearby settlements.
These emissions are not subject to accounting and are not included in the reporting under the internal system of quotas for GHG emissions of the Republic of Qazaqstan. Information on them is provided only in reports to Parent Companies. For 2022 the indirect GHG emissions at KPO amounted to 1,802 tons of CO2.