Sustainability
- Home
- /
- Sustainability
- /
- Safety
- /
- Safety Performance


Safety Performance
We work continuously on enhancing our processes towards zero incident performance.
We plan our health and safety activities by tracking our progress and monitoring the world events. We measure our success in health and safety by frequency of incidents over a set amount of work in man-hours. Our health and safety records are presented for the period 2013 — 2021 with a focus on 2021.
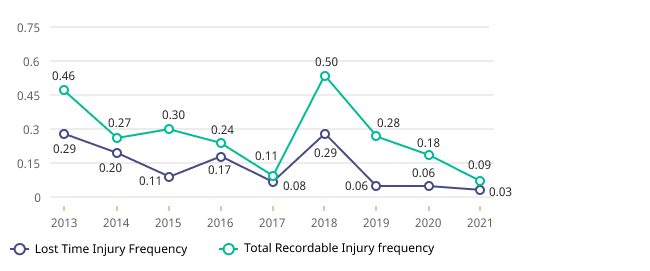
The graph below demonstrates the Lost Time Injury Frequency (LTIF)1 and Total Recordable Injury Frequency (TRIF)2.
In 2021, the total number of recordable injuries in KPO reduced by half. The number of Lost Time Injuries decreased as well from two in 2020 to one injury in 2021. In 2021, LTIF was 0.03 (vs 0.06 in 2020) and TRIF — 0.09 (vs 0.18 in 2020). The main reasons for incident decrease are continuous implementation of the Safety Leadership Improvement Journey, completion of HSE Competence Assessment of KPO Supervisors, implementation of HSE Communication Plan.
We investigate all incidents to avoid reoccurrence. In addition, we share learnings from incidents with our contractors and other interested parties and adopt safety improvement practices from other companies.
LTI Frequency and TRI Frequency: KPO and Contractors, 2013-2021
Note:KPO uses the following method to calculate LTI and TRI frequencies:
1Frequency of Lost Time Injuries (LTIF) = number of Lost Time Injuries (lost work day cases + fatalities) x 1 000 000 / man-hours.
2Frequency of Total Recordable Injuries (TRIF) = number of recordable incidents (lost work day cases + medical treatment cases + restricted work day cases) x 1 000 000 / man-hours).
No severe Road Traffic Incident (RTI) was reported in 2021. The RTI frequency per 1 million km driven remained zero in 2021 the same as in 2020. The zero rate is associated with the implementation of Road Safety Improvement Plan, driving competence assessment and other achievements as described in the Road Safety section.
In 2021, the kilometers driven by KPO vehicles amounted to 40.2 million km, compared to 37.9 million km in 2020.
Road Traffic Incident Frequency: KPO and Contractors, 2019-2021

KPO RTIF calculation method: RTIF = number of RTI (severe) x 1,000,000 / km driven.
Fatality Frequency: KPO and contractors, 2019-2021

Note: Fatality frequency calculation method used by KPO: fatality frequency (per million man-hours worked) = number of fatalities x 1,000,000 / man-hours worked. There was one fatal incident at KPO in 2018.
Peer comparison
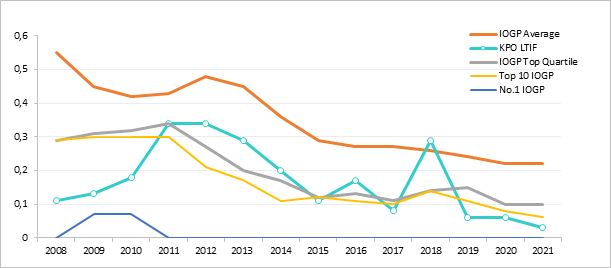
Every year we review our key safety performance indicators against the other O&G producers’ indicators reported by International Organisation of Oil and Gas Producers (IOGP). IOGP annually publishes HSE performance indicators on the website www.iogp.org.
In 2021, the number of Lost Time Injuries in KPO decreased (1 LTI in 2021 versus 2 LTIs in 2020). If compared with other peer companies in 2021, KPO LTIF is better than the performance of IOGP 10 top and IOGP average
KPO Performance versus IOGP, 2008-2021