Sustainability
- Home
- /
- Sustainability
- /
- Energy efficiency
- /
- Energy consumption


Energy consumption
In accordance with the energy saving and energy efficiency legislation requirements, KPO conducts a mandatory energy audit every five years.
The targets of an energy audit is to assess the Company’s efficiency in using fuel and energy resources and to develop measures ensuring rational energy consumption and increasing energy efficiency.
In 2021, a mandatory energy audit was completed at KPO by a specialized company in line with which, the overall KPO’s energy saving and energy efficiency activities were rated as «excellent». Also, energy efficiency improvement measures were proposed, featuring economic feasibility and practical application. One of the measures was the installation of a waste heat boiler at the gas turbine power plant is scheduled to include in the Energy Saving and Energy Efficiency Action Plan for 2022-2025.
In 2021, the energy consumption totalled 1,029,538 tonnes of coal equivalent compared to 1,067,135 tonnes of coal equivalent in 2020. The decrease in energy consumption is associated with repair work on gas turbine generators. Table below shows the energy consumption volumes broken down by energy type.
KPO energy consumption in 2019 — 2021
Type of energy | Unit of measure | Energy consumption, physical units | Energy consumption, tonnes of coal equivalent | Energy consumption, GJ | ||||||
2021 | 2020 | 2019 | 2021 | 2020 | 2019 | 2021 | 2020 | 2019 | ||
Fuel gas | Thous.m3 | 832,863 | 863,029 | 826,806 | 1,026,088 | 1,063,251 | 1,018,625 | 30,074,639 | 31,163,893 | 29,855,886 |
Electric power (purchased) | MW/h | 6,710 | 6,236 | 7,244 | 825 | 767 | 891 | 24,181 | 22,482 | 26,115 |
Diesel fuel | m3 | 705 | 1,188 | 739 | 888 | 1,498 | 932 | 26,027 | 43,905 | 27,468 |
Gasoline | m3 | 228 | 199 | 226 | 251 | 220 | 249 | 7,357 | 6,439 | 7,301 |
Heating (in rented offices) | Gcal | 10,388 | 9,781 | 8,731 | 1,486 | 1,399 | 1,249 | 43,555 | 40,994 | 36,595 |
TOTAL | 1,029,538 | 1,067,135 | 1,021,946 | 30,175,759 | 31,277,713 | 29,953,365 | ||||
In 2021, the energy intensity indicator was 1.10 GJ /tonnes of hydrocarbons, which was below the average energy intensity indicator of the companies that submitted their reports to the IOGP (1.4).
Dynamics of energy intensity in 2019 — 2021
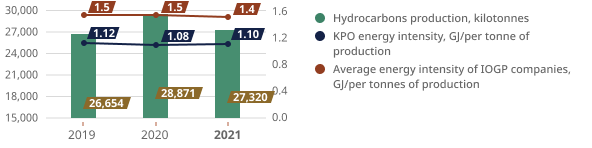
Note: Data sources are Annual reports of the International Association of Oil and Gas Producers (IOGP) — ‘Environmental Performance Indicators — 2020 Data’.